CCI indicator (Commodity Channel Index) is a very popular indicator among traders. Although beginner traders tend to pay less attention to the CCI at the start of their learning curve, then they return to simplicity and find potential on the CCI indicator.
There are various CCI indicators, just by looking at the screenshots below with various CCI versions, we will understand that there is a large package of trading methods behind every CCI indicator either simple or modified.
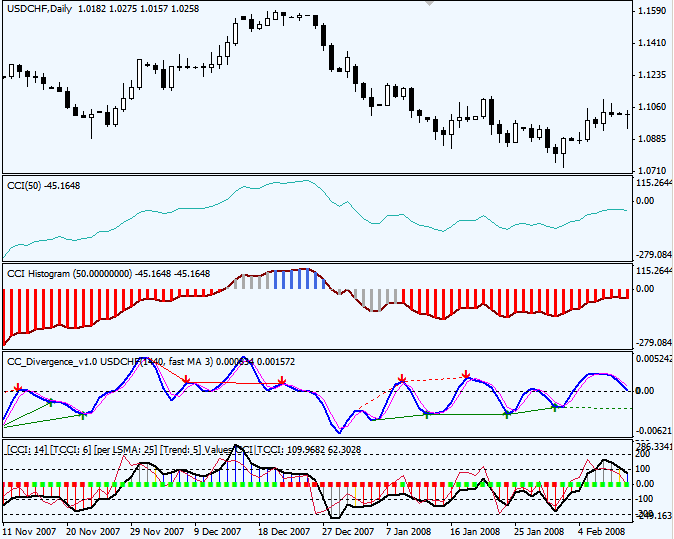
Here we can collect all known variations of the CCI indicator used in MetatTader4:
![]() CCI.mq4
CCI.mq4
![]() CCI_Histogram.mq4
CCI_Histogram.mq4
![]() CCI_Divergence.mq4
CCI_Divergence.mq4
![]() Real_Woodie_CCI.mq4
Real_Woodie_CCI.mq4
![]() FX_Snipers_T3_CCI.mq4
FX_Snipers_T3_CCI.mq4
![]() FX_Snipers_Ergodic_CCI_Trigger.mq4
FX_Snipers_Ergodic_CCI_Trigger.mq4
![]() FX_Snipers_Ergodic_CCI_Trigger_Signals.mq4
FX_Snipers_Ergodic_CCI_Trigger_Signals.mq4
Indicators that use CCI indicator base include:
![]() Forex_Freeway_2.mq4
Forex_Freeway_2.mq4
![]() MTF_Forex_Freedom_Bar.mq4
MTF_Forex_Freedom_Bar.mq4
Additional literature for the CCI indicator:
![]() WoodiesCCI.pdf
WoodiesCCI.pdf
![]() Trading-Woodies-CCI-System.pdf
Trading-Woodies-CCI-System.pdf
Trading basics with CCI indicator
Developed by Donald Lambert, the original CCI consists of a single line that oscillates between +/- 200.
The CCI indicator was created to identify bullish and bearish market cycles and determine the market turning point, the strongest and weakest period of the market. Designed for commodities, CCI has quickly found its applications in other markets, including Forex. It is recommended to use CCI for point entries and exit points when CCI reaches the +/- 100 level.
It goes as follows:
When CCI moves above 100, there is a strong uptrend confirmation, so traders have to open Buy position. this trade is held during the CCI trading above 100. The exit will be created when the CCI returns below 100. The opposite means the downtrend is the line below -100. Since 1980 when the CCI indicator was first introduced, traders have found many ways to interpret CCI and expand trade rules.
CCI and Zero Line
An aggressive way to enter the market reacts to the CCI line when the CCI line crosses the zero level. When CCI moves above Zero, traders will take action BUY and expect the trend will continue. Conversely, when the CCI falls below zero, the trader will take a sell position and seek profit from the initial signal from the downtrend.

Simple rules:
- Above zero – Buy Area ‘,
- below zero – Sell area ‘;
except, if it has reached the overbought and oversold islands.
CCI Area Overbought & Oversold
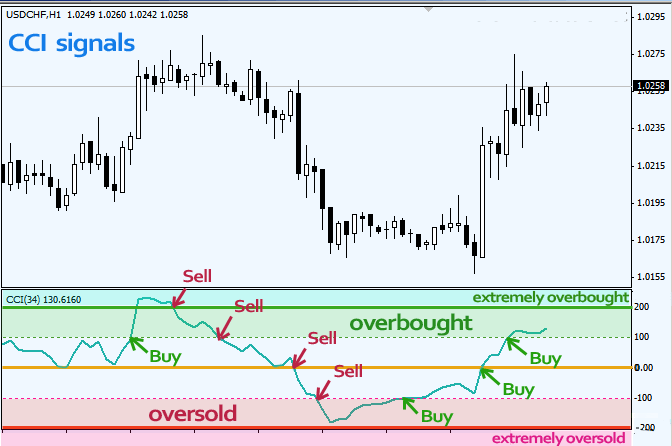
With CCI we can separate the indicator readings for 3 zones:
- It is known, the zone above the zero level (bullish) and Zone below zero (bearish). Trading rule: when the price is past the zero line, Buy / Sell depends on the direction of a crossover.
- An overbought zone – CCI above 100, an oversold zone – CCI below -100.
- A extrem overbought zone – CCI above 200, and zone extrem oversold – CCI below -200.

Bonus: CCI trading measures
With what we know so far, we can already read and trade with CCI indicators.
Let us discuss through the figures in the picture below:
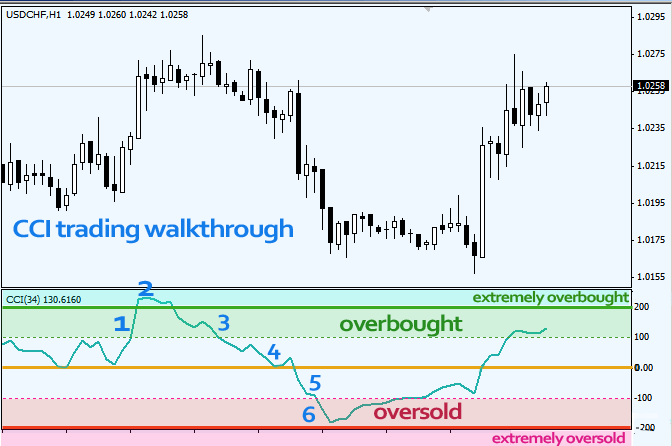
- CCI is in the overbought zone. By the time he enters there, we can place Buy orders, because we know that a strong uptrend has been established.
- CCI goes up to a extrem oversold level, this is where we know that the reversal is imminent, so the action is to tighten stop loss and exit well after the candlestick reversal is formed or wait until CCI is below 200.
- When CCI exits zone 200, we must close all remaining buy positions and prepare sell positions. With CCI exit from the extrem overbought zone is the perfect time to start trading with a sell position.
- At the moment the price is out of the overbought zone, we close all buy positions and can immediately open a sell position.
- CCI crosses the Zero level and is now in the sell area. We can reopen the sell position.
- The price enters the oversold zone (below -100), which tells us that the downtrend is already running strong. We can add a sell position until the CCI line rises back above -100.