RSI indicator (Relative Strength Index) is another momentum indicator developed by Welles Wilder. The standard setting period for RSI is period 14, which can be applied at any time span. The RSI indicator compares the average up closing and down closing for a given time period.
Trading with RSI involves the following signals:
- RSI is moving above level 50 mean uptrend confirmed, and below level 50 mean downtrend confirmed.
- RSI peaked above level 70 means the market is overbought.
- RSI staying above level 70 means a strong uptrend runs.
- RSI out of level 70 means a downtrend is in progress, or at least a correction
- RSI trend line breakout means early warning about breakout trend line chart.
- RSI deviate from the price on the chart means the early warning of a trend change.
How to Trading with RSI Indicator
The RSI indicator is often referred to as an overbought and oversold indicator. RSI does not provide Buy or Sell signals, after reaching oversold or overbought areas, there are certain rules that help to identify the correct time for entry and exit.
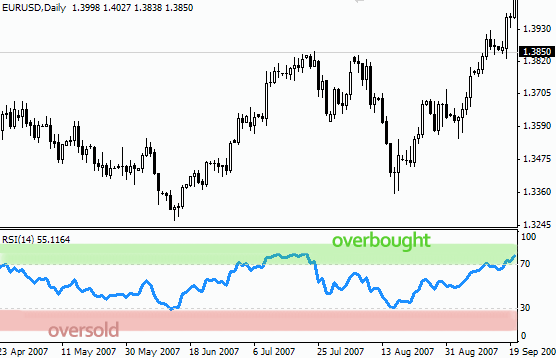
A reading above 70 indicates an overbought market, while a reading below 30 indicates an oversold market. However, after a RSI above 70 it has not been a signal to Sell immediately, because the RSI may stay in the overbought area for a long time, even when a strong uptrend develops, a reading above 70 is the start that the trend continues, the opposite is true for a downtrend when the number is below 30.
In order to enter the market at the right moment traders must wait for the RSI to leave the overbought or oversold area. For example, when the RSI goes above 70, the trader will prepare Sell, but the actual trade will take place only when the RSI cuts down the level 70.
Instead it applies to an oversold RSI: once the RSI declines below 30, traders wait for the indicator to exit the oversold area and rise above 30 before making a buy order.
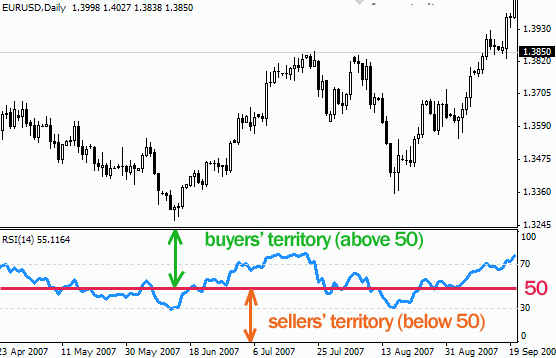
Traders also use level 50 of the RSI indicator, which separates the power of purchasing power and selling power in the market. a particular trading strategy uses a RSI level 50 to confirm a long (buy) and sell (short) entry by looking at the RSI position in relation to level 50.
RSI trend lines
The RSI indicator has another useful feature: Traders use RSI to describe trend lines. While the trend line of the RSI remains intact, it confirms that the trend remains intact.
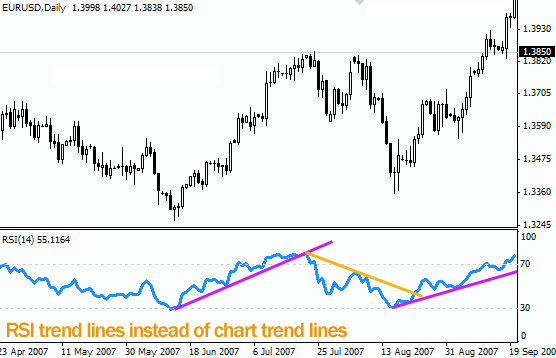
With the trendline of the RSI, traders can receive a warning before any upcoming trend changes. The trend line of the RSI is especially useful for larger periods of time.
Trading divergence with RSI indicator
Another way to exploit RSI is to take advantage of the RSI signal difference.
When the RSI approaches level 30 to look for bullish divergence => slowly rising RSI versus already declining prices.
As the RSI approaches level 70, traders see a bearish divergence, which actually happens when the RSI reading starts to decline while the price continues to climb. RSI Divergence suggests that momentum is now over and traders should look to protect their profits and be ready to trade in the opposite direction.
RSI Indicator Formula
RSI = 100 – 100 / (RS + 1)
Where:
RS = Average Upward Price Change / Average Downward Price Change
Average Upward Price Change = 13 (current previous Upward Price Change) 13 + current Upward Change] / 14
First Average Upward Change = Total of Upward Changes during past 14 periods / 14 Average Downward Price Changes = [(previous Average Downward Price Change) x 13 + current Downward Change] / 14
First Average Downward Change = Total of Upward Changes during past 14 periods / 14
For the calculation of Downward Price Changes are taken as positive values.
How to install the RSI Indicator on the MetaTrader
To install RSI indicator on Metatrader platform click Insert => Indicator => Oscillator => Relative Strenght Index.