Ichimoku Definition
The Ichimoku Kinko Hyo (Equilibrium chart at a glance) is a comprehensive technical analysis tool introduced in 1968 by Tokyo columnist Goichi Hosoda. The concept of the system was to provide an immediate vision of trend sentiment, momentum and strength at a glance perceiving all the Ichimoku’s five components and a price in terms of interactions among them of a cyclical type related to that of human group dynamics.
How to Use Ichimoku Kinko Hyo Indicator
The Ichimoku indicator consists of five lines which may all serve as flexible support or resistance lines, whose crossovers may as well be assumed as additional signals:
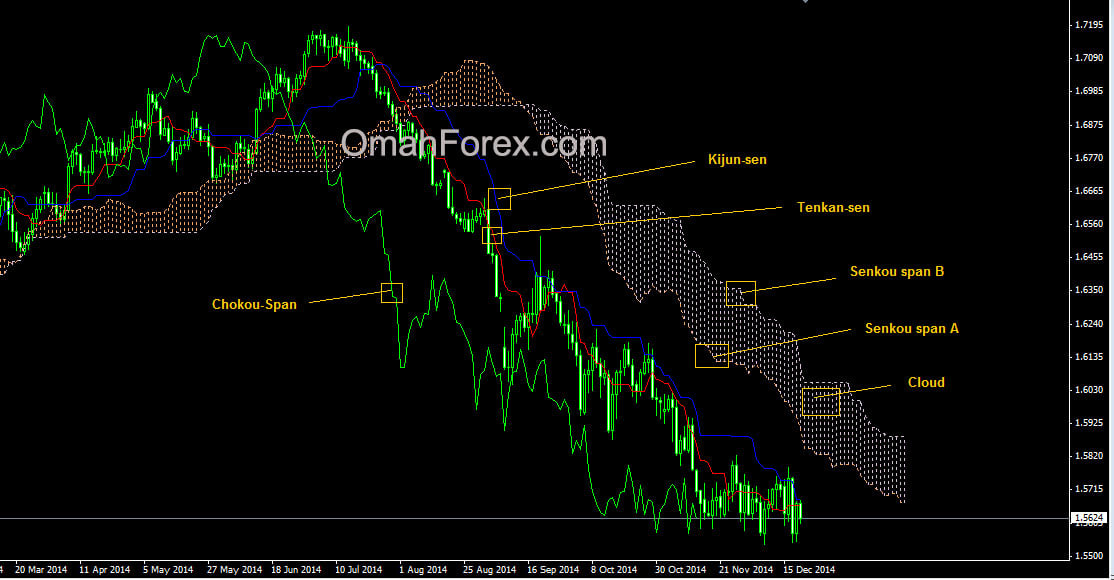
- Tenkan-Sen (Conversion line, red)
- Kijun-Sen (Base line, blue)
- Senkou Span A (Leading span A, yellow boundary of the cloud)
- Senkou Span B (Leading span B, white boundary of the cloud)
- Chikou Span (Lagging span, green)
Kumo (Cloud) is a central element of the Ichimoku system and represents support or resistance areas. It is formed by Leading Span A and Leading Span B.
Determining the trend persistence and corrections:
- Price moving above the cloud indicates an uptrend
- Price moving below the cloud indicates a downtrend
- Price moving within the cloud indicates a sideways trend
- Cloud turning from brown to white indicates a correction during an uptrend
- Cloud turning from white to brown indicates a correction during a downtrend
Determining support and resistance:
- Leading span A serves as a first support line for an uptrend
- Leading span B serves as a second support line for an uptrend
- Leading span A serves as a first resistance line for a downtrend
- Leading span B serves as a second resistance line for a downtrend
Strong Buy/Sell signals occurring above or below the cloud:
- Conversion line crosses Base line up from below is a signal to buy
- Conversion line crosses Base line down from above is a signal to sell
Less reliable Buy/Sell signals occurring within the cloud:
- Conversion line crosses Base line up from below is a signal to buy
- Conversion line crosses Base line down from above is a signal to sell
Ichimoku Trading Strategy
Traders use the Ichimoku strategy to identify the trend. For a bullish signal this trading strategy sets three criteria. First, the trend is bullish when prices reach above the lowest line of the cloud. Second, a bullish signal triggers when prices reverse and reach above the Conversion Line. And third, the trend is bullish when the price moves below the Base Line.
Ichimoku Formula (Ichimoku Kinko Hyo Calculation)
- Tenkan-Sen (Conversion line,) is (9-period high + 9-period low)/2
- Kijun-Sen (Base line) is (26-period high + 26-period low)/2
- Senkou Span A (Leading span A) is (Conversion Line + Base Line)/2
- Senkou Span B (Leading span B) is (52-period high + 52-period low)/2
- Chikou Span (Lagging span) is close price plotted 26 periods in the past
Installing the Ichimoku indicator in MT4 chart
Ichimoku indicator is standard MT4 indicators, you can install on your chart , click Insert >> Indicator >> Trend >>Ichimoku Kinko Hyo. The default setting for the Ichimoku indicator is Tenkan-sen = 9, Kijun-sen = 26 and Senko Span B = 25, we recommend to keep using the default settings.