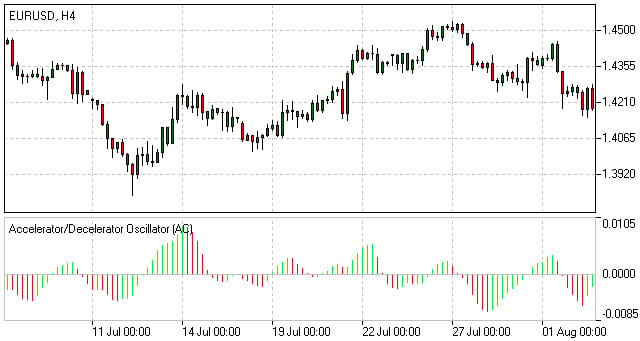
AC Oscillator Definition
Acceleration/Deceleration (AC) technical indicator signals the acceleration or deceleration of the current market driving force.
How to Use Acceleration/Deceleration
The indicator is fluctuating around a median 0.00 (zero) level which corresponds to a relative balance of the market driving force with the acceleration. Positive values signal a growing bullish trend, while negative values may be qualified as a bearish trend development. The indicator changes its direction before any actual trend reversals take place in the market therefore it serves as an early warning sign of probable trend direction changes.
The indicator color changes alone are very important as the current green line (irrespectively of the value) warns against long positions the same way as the red one would against selling.
To enter the market along with its driving force one needs to watch for both value and color. Two consecutive green columns above the zero level would suggest you to enter the market with a long position while at least two red columns below the zero level might be taken for a command to go short.
Fake signals prevail in timeframes smaller than 4 hours.
Acceleration/Deceleration Oscillator Formula (Calculation)
AC bar chart is the difference between the value of 5/34 of the driving force bar chart and 5-period simple moving average, taken from that bar chart.
AO = SMA(median price, 5)-SMA(median price, 34)
AC = AO-SMA(AO, 5)


