Momentum Indicator Definition
Momentum Oscillator is an indicator that shows trend direction and measures how quickly the price is changing by comparing current and past prices.
How to Use Momentum Indicator In Trading
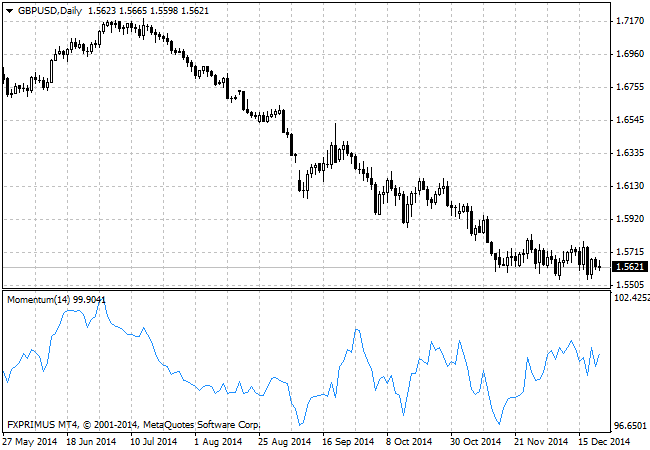
The indicator is represented by a line, which oscillates around 100. Being an oscillator, momentum should be used within price trend analysis.
Crossing the x-axis:
- It is believed that if the indicator climbs above 100 during an uptrend, it is a bullish signal;
- Otherwise if the indicator falls below 100 during a downtrend, a bearish signal appears.
Falling out of its normal range:
- Extreme points mean that the price has posted its strongest gain or loss for a particular number of moving periods, supporting trend strength;
- At the same time if the price movement was too rapid, they may indicate possible overbought and oversold areas.
Divergence patterns:
- If the price hits a new high, but the indicator does not, that could mean that investor sentiment is actually lower;
- And on the contrary if the price falls to a new low, but the indicator does not support the drop, it is a signal that the trend may end soon.
Momentum Indicator Formula (Calculation)
Momentum = (Current close price / Lagged close price) x 100
How to Install Momentum Indicator in MT4 Charts
Momuntum indicator is standard Metatrader indicators, to put this indicator in your chart, please click Insert >> Indicators >> Oscillator >> Momentum . The default setting momentum indicator is a period of 14 and apply to Close.