ATR Indicator (Average True Range) developed by Wilder, gives traders an overview of the volatility history in order to prepare for trading in the real forex market.
Currency pairs that get a lower ATR reading show a low market volatility, while currency pairs with higher ATR indicator readings require proper trade adjustment in accordance with higher volatility.
Wilder uses Moving Average to clarify the reading of the Average True Range indicator, so that the ATR indicator looks as follows:
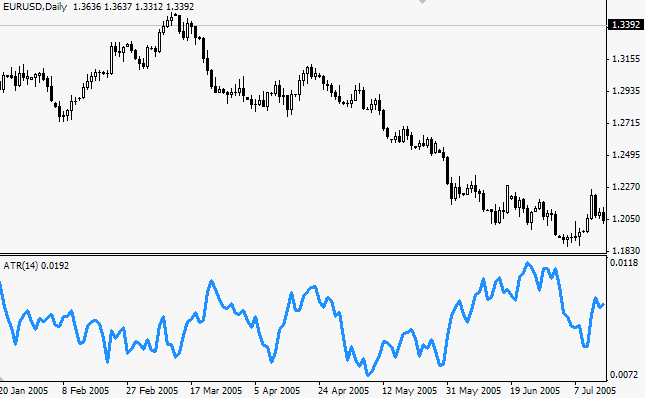
How to Read ATR Indicator
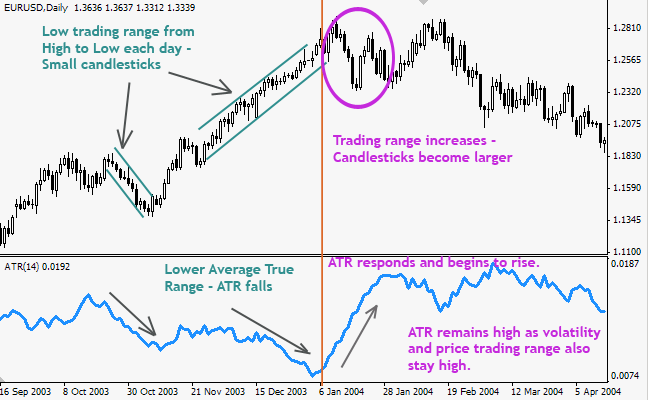
As long as the volatility of the ATR market moves up, in time the market volatility of the lower ATR is less move. When the price bar is short, it means there is a bit ground covered from the highest price to the lowest price of the day, then the trader will see the ATR indicator move lower. If the price bar begins to grow and becomes larger, representing a larger true range, the ATR indicator line will increase.
The ATR indicator shows no trend or trend duration.
How to Trade with ATR Indicators
The default ATR setting is 14. Wilder uses daily charts and ATR 14 days to explain the concept of the Average Trading Range indicator.
The ATR indicator helps to determine the average size of the daily trading range. In other words, it illustrates how market volatility and how large it moves from one point to another during the trading day.
ATR is not a primary indicator, it does not send a signal about the direction of the market or duration, but one of the measuring tools and one of the most important market parameters – price volatility. Traders use the Average true range indicator to determine the best position for their traded Stop orders – stopping so that with the help of ATR will correspond to the most actual market volatility.
Let’s take an example:
EUR /USD and GBP/JPY pairs. The question is: do you place the same stop order distance for both pairs? Probably not. It will not be the best option if you choose to risk 2% of the accounts in both cases. Why? EUR /USD is moving an average of 120 pips a day, while GBP/JPY makes 250-300 pips per day. The same stop distance for both pairs will not make sense.
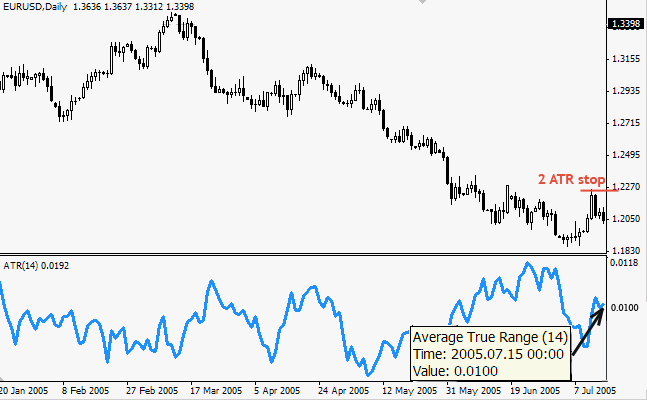
How to Set Stop with Average True Range Indicator
Look at the ATR value and stop is set from 2 to 4 times the ATR value. Let’s look at the picture below. For example, if we sell in the last candle and choose to use 2 ATR stop, then we will take the current ATR value, which is 100, and multiply by 2.
100 x 2 = 200 pips (2 ATR stop now)
How to Calculate Average True Range
Using simple Range calculations is not efficient in analyzing volatility market trends, so Wilder tidied the True range with Moving Average and we have an Average True Range. ATR is the Moving Average of TR for a given period (14 days by default).
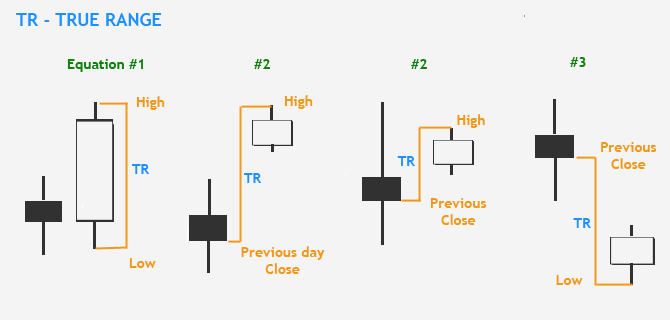
True range is the largest value of the following three equations:
1. TR = H – L
2. TR = H – Cl
3. TR = Cl – L
Where:
TR – True Range
H – High today
L – Low today
Cl – Close Price yesterday
Normal days will be calculated according to the first equation. the open price with upward gap will be calculated by equation # 2, where the day’s volatility will be measured from the highest price to the previous closing price. The open price with a downward gap will be calculated using equation # 3 by subtracting the previous closing price from the day’s lowest price.
true range
ATR method to filter entries and avoid whipsaws price (swing)
ATR never produces a signal to buy or sell. These are indicators that help to set the trading system better.
With ATR filter follow these steps:
- Measures ATR for the previous 14 days (default) or 21 days (other values ??are preferred).
- For example, we have found that EURUSD ATR 14 days is located at 110 pips.
We choose to enter at breakout + 20% ATR (110 x 20% = 22 pips). - Now, instead of rushing on the breakout and risking going to swing, we go in the price of 1.3000 + 22 pips = 1.3022.
- We give some initial pips on the breakout, but have taken extra precautions to avoid a swing in an instant .
ATR for Support / Resistance level
The same approach as the above method with the whipshaw filter (swing), applies to entries after the trend line or horizontal support / resistance is bypassed. Merchants use ATR based on filters. For example, if the support level is broken at 1.3000, one can Sell at ATR 20% below the breakout line.
ATR for Trailing Stop
Another common approach to using the ATR indicator is based on a trailing stop, also known as stop volatility. Here 30%, 50% or higher ATR values can be used. With the same 110 pips range for EURUSD, if we choose to set 50% ATR trailing stop, it will be placed behind the price at a distance: 110 x 50% = 55 pips.